Income Statement Explained: How to Read a Company’s Profit & Loss Report
In our last post, we talked about fundamental analysis and how it helps you evaluate a company like a detective. One of the most powerful tools in your detective kit is the income statement. Think of it as a company’s financial report card—it tells you how well the company is performing over a specific period. In this post, we’ll break down what an income statement is and how to read it like a pro to understand a company’s profit and loss.
What’s an Income Statement?
An income statement shows a company’s financial performance over a specific period, usually a quarter or a year. It tells you how much revenue the company generated, how much it spent, and how much profit (or loss) it made. Essentially, it answers the question: “Is the company making money?” This critical financial report is essential for stock analysis.
Here’s a simple breakdown of what you’ll find on an income statement:
- Revenue: The total amount of money earned from sales or services. This is often called the “top line.”
- Cost of Goods Sold (COGS): The direct costs associated with producing the goods or services sold.
- Gross Profit: Revenue minus COGS. This shows how much profit the company made before deducting other expenses.
- Operating Expenses: Costs related to running the business, like rent, salaries, and utilities. These are crucial for understanding the company’s efficiency.
- Net Income: The “bottom line.” This is the company’s total profit after all expenses are deducted. A positive net income is a key indicator of financial health.
Analogy: Imagine you run a lemonade stand. Your income statement would show how much money you made from selling lemonade (revenue), how much you spent on lemons and sugar (COGS), and your profit after paying for the table and chairs (net income). This simple example demonstrates the core of a profit and loss statement.
Breaking Down the Income Statement Components
Let’s dive deeper into each component of the income statement for thorough financial performance assessment:
- Revenue: Look for consistent growth in revenue over time. This indicates the company is selling more products or services and expanding its market reach.
- COGS: Compare COGS to revenue. If COGS is rising faster than revenue, the company’s profitability might be at risk, signaling inefficiency in production.
- Gross Profit: A healthy gross profit is a good sign. It means the company can efficiently produce and sell its products, contributing to overall company profit.
- Operating Expenses: Monitor how these expenses grow relative to revenue. Ideally, they should grow slower than revenue to maintain strong net income.
- Net Income: This is the ultimate measure of profitability. Positive and growing net income is a strong indicator of a healthy company and a good sign for investment decisions.
Example: If Company A has $10 million in revenue, $4 million in COGS, and $2 million in operating expenses, their net income would be $4 million ($10M – $4M – $2M). If Company B has the same revenue but higher operating expenses, their net income might be lower. This simple comparison highlights the importance of each line item when reading financial statements.
Red Flags to Watch For in an Income Statement
Not all income statements are created equal. Here are some red flags to watch for when assessing financial performance:
- Declining Revenue: Consistently falling revenue can indicate a loss of customers or market share, signaling potential trouble for company profit.
- Rising COGS: If the cost to produce goods is increasing faster than revenue, margins may be shrinking, directly impacting net income.
- Surging Operating Expenses: Rapidly increasing expenses can eat into profits and signal inefficiency or mismanagement, affecting the company’s ability to generate strong net income.
Real-World Example: A tech company reporting rising revenue but rapidly increasing operating expenses might be overspending on expansion, which could hurt profitability in the short term. This scenario is a key reason why understanding the income statement is crucial for stock analysis.
Practice Time: Analyze a Real Company’s Income Statement
Now it’s your turn to practice! Let’s walk through a simplified example of a fictional company’s income statement:
- Revenue: $500,000 (up 10% from last year)
- COGS: $200,000
- Gross Profit: $300,000 ($500,000 – $200,000)
- Operating Expenses: $150,000
- Net Income: $150,000 ($300,000 – $150,000)
Questions to Ask when reading financial statements:
- Is revenue growing consistently?
- Are COGS and operating expenses under control relative to revenue?
- Is net income positive and increasing?
For a real-world example, try looking up the income statement of a company you’re familiar with, like a favorite brand. You can usually find these on the company’s investor relations page or reliable financial news websites (e.g., Yahoo Finance, Google Finance). This practical exercise will strengthen your financial analysis skills.
Conclusion
The income statement is your window into a company’s financial performance. By understanding revenue, COGS, operating expenses, and net income, you can quickly assess if a company is making money and how efficiently it’s doing so. Remember, a healthy income statement is a key indicator of a strong investment opportunity and an essential part of fundamental analysis.
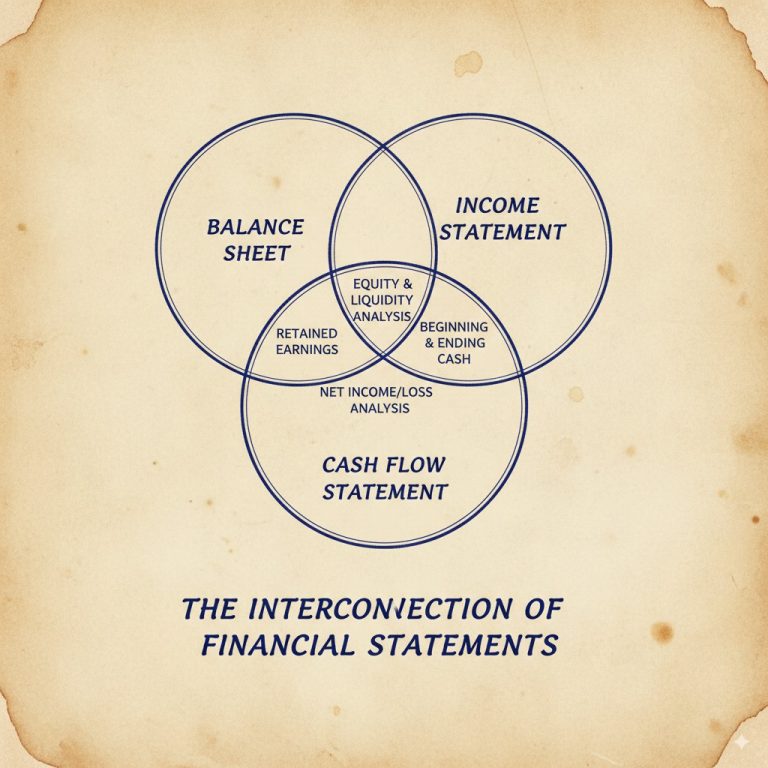
In our next blog post, we’ll explore the cash flow statement and why it’s crucial to understanding a company’s true financial health. Stay tuned for more insights into reading financial statements!
Ready to analyze your first income statement? Pick a company you love and look up their financials today. Share your findings or questions in the comments below! Your journey to mastering stock analysis starts here.