Connecting the Dots: An Investor’s Guide to Integrated Financial Analysis
Introduction
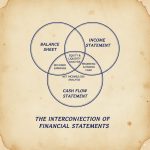
By now, you’ve learned about the income statement, cash flow statement, and balance sheet—three critical documents for evaluating a company’s financial health. But here’s the thing: they don’t exist in isolation. These statements are deeply interconnected, a concept often referred to as the “three-statement model.” Understanding how they work together gives you a comprehensive view of a company’s performance. This process, known as integrated financial analysis, helps you understand the correlation between financial statements and see a story that numbers alone can’t tell.
Section 1: The Core Correlation Between Financial Statements
The financial statements tell a cohesive story. Here’s how they connect:
- The Income Statement to the Balance Sheet:
- Net income from the income statement flows directly into the shareholders’ equity section of the balance sheet. The formula that bridges these two statements is:
Ending Retained Earnings = Beginning Retained Earnings + Net Income − Dividends
This equation shows exactly how profit generated during a period increases the cumulative value held within the company.
- Net income from the income statement flows into the balance sheet as retained earnings (part of shareholders’ equity).
- Example: If a company earns $100,000 in net income and pays out $30,000 in dividends, the remaining $70,000 increases retained earnings on the balance sheet.
2. The Income Statement to the Cash Flow Statement:
Net income, the bottom line of the Income Statement , serves as the starting point for calculating Cash Flow from Operations. To get a true picture of cash, we must make adjustments for non-cash expenses (like depreciation) and changes in working capital (e.g., accounts receivable and inventory). This reconciliation of profit to cash is the entire purpose of the Cash Flow Statement .
- Example: High accounts receivable on the balance sheet might mean less cash from operations, even if the income statement shows strong revenue.
3. The Cash Flow Statement to the Balance Sheet:
The final cash balance calculated on the cash flow statement flows back to the top of the balance sheet for the next period. The final cash balance is then reflected on the Balance Sheet , a snapshot of the company’s financial position at a single point in time. Activities like buying equipment (investing) or issuing debt (financing) also change the corresponding asset and liability accounts on the balance sheet.
- Example: If a company uses cash to buy equipment (an investing activity), cash decreases on the balance sheet, but property and equipment increase.
Analogy: Think of the income statement as the engine generating profit, the cash flow statement as the fuel gauge tracking liquidity, and the balance sheet as the dashboard showing the company’s overall condition.
Section 2: A Walkthrough of a “GrowTech Inc.” Financial Journey
Let’s follow a fictional company, GrowTech Inc., through one fiscal year. To see the full impact, we’ll start with its opening balance sheet.
GrowTech Inc. – Balance Sheet (Start of Year)
| Assets | Liabilities & Equity | ||
| Cash | $50,000 | Long-Term Debt | $100,000 |
| Property & Equipment | $200,000 | Shareholders’ Equity | $150,000 |
| Total Assets | $250,000 | Total Liabilities & Equity | $250,000 |
Now, let’s see what happens during the year.
1. Revenue and Expenses (Income Statement):
- GrowTech earns $500,000 in revenue and spends $300,000 on expenses, resulting in $200,000 net income.
2. Cash Flow Impact (Cash Flow Statement):
- Despite the $200,000 net income, GrowTech’s cash flow from operations is only $150,000. This is because $50,000 of its revenue is now in accounts receivable (customers haven’t paid yet).
- The company invests $100,000 in new equipment (a cash outflow for investing activities).
- It takes out a $50,000 loan to help fund its growth (a cash inflow for financing activities).
- The total change in cash for the year is: $150,000 (operations) – $100,000 (investing) + $50,000 (financing) = $100,000 increase in cash.
3. Balance Sheet Changes: The new balance sheet reflects every transaction from the year.
GrowTech Inc. – Balance Sheet (End of Year)
| Assets | Liabilities & Equity | ||
| Cash | $150,000 | Long-Term Debt | $150,000 |
| Accounts Receivable | $50,000 | Shareholders’ Equity | $350,000 |
| Property & Equipment | $300,000 | ||
| Total Assets | $500,000 | Total Liabilities & Equity | $500,000 |
Let’s break down the changes:
- Cash is now $150,000 (the starting $50,000 + the $100,000 increase from the cash flow statement).
- Accounts Receivable is a new $50,000 asset.
- Property and Equipment increased to $300,000 (the starting $200,000 + the $100,000 new purchase).
- Long-Term Debt grew to $150,000 (the original $100,000 + the new $50,000 loan).
- Shareholders’ Equity (specifically retained earnings) increased to $350,000 (the starting $150,000 + the $200,000 in net income).
As you can see, the accounting equation (Assets=Liabilities + Equity) remains perfectly in balance. This interconnected flow is the foundation of all financial modeling.
Section 3: Using Ratios to Connect the Dots
The true power of this analysis comes from using financial ratios that pull data from multiple statements. These metrics provide a much richer context than looking at any single number.
1. Return on Equity (ROE): The Ultimate Profitability Metric
Formula: ROE= (Net Income) / (Shareholder’s Equity)
- Connection: This directly links the Income Statement (Net Income) with the Balance Sheet (Shareholder’s Equity).
- What it tells you: It measures how efficiently a company is using its equity base to generate profits. A consistently high ROE is a sign of a strong business.
2. Asset Turnover Ratio: The Efficiency Metric
Formula: Asset Turnover= (Revenue) / (Total Assets)
- Connection: This links the Income Statement (Revenue) with the Balance Sheet (Total Assets).
- What it tells you: It shows how well a company is using its assets to generate sales. A low turnover might suggest a company has invested too heavily in assets that aren’t producing revenue.
3. Cash Flow to Debt Ratio: The Solvency Metric
Formula: Cash Flow to Debt=(Cash Flow from Operations) / (Total Debt)
- Connection: This links the Cash Flow Statement (Cash Flow from Operations) with the Balance Sheet (Total Debt).
- What it tells you: This is a crucial health check. It shows a company’s ability to cover its total debt with the cash it generates from its core business. A company with high profits but low cash flow to cover its debt is a major red flag.
Section 4: Why Integrated Financial Analysis is Crucial for Investors”
Understanding the interplay between financial statements helps you:
- Spot Discrepancies: A company might report high profits but have declining cash flow and rising debt—signs of potential trouble.
- Assess Sustainability: Consistent alignment between the statements indicates a healthy, sustainable business.
- Make Informed Decisions: By seeing the full picture, you can better judge whether a company is a good investment.
Real-World Example: During the 2008 financial crisis, many companies reported strong profits (aggressive revenue recognition) while hiding debt in off-balance-sheet entities and generating poor cash flow. This disconnect signaled underlying weakness long before the market crashed.
Section 5: Your Turn: Analyze a Real Company’s Financials
Now that you understand how the statements connect, try analyzing a real company.
- Pick a Company: Choose a well-known brand like Apple or Nike.
- Find the Financials: Visit their investor relations page or use the SEC’s Financial Reporting database (EDGAR) to find their latest 10-K report.
- Trace the Flow:
- Start with revenue on the income statement.
- Follow net income to retained earnings on the balance sheet.
- Check how cash flow from operations compares to net income.
- See how investing and financing activities impact the balance sheet.
Pro Tip: Look for consistency. If a company’s cash flow consistently supports its income statement and balance sheet strength, it’s a positive sign.
Conclusion
The income statement, cash flow statement, and balance sheet are three pieces of a financial puzzle. By understanding how they connect, you gain a holistic view of a company’s health. This integrated analysis is your superpower as an investor—helping you make smarter, more informed decisions.
In our next blog post, we’ll transition from fundamentals to technical analysis, where we’ll learn how to read stock charts and identify trends. Stay tuned!
Ready to connect the dots with a real company? Pick one you’re curious about and walk through its financial statements. Share your insights in the comments below!
Internal Links:
- Net income, the bottom line of the Income Statement, serves as the starting point for two other critical documents.”
- The final cash balance is then reflected on the Balance Sheet, a snapshot of the company’s financial position at a single point in time.
- This reconciliation of profit to cash is the entire purpose of the Cash Flow Statement .