What Is a Balance Sheet? A Guide to a Company’s Financial Health
Understanding Assets, Liabilities & Equity
Introduction
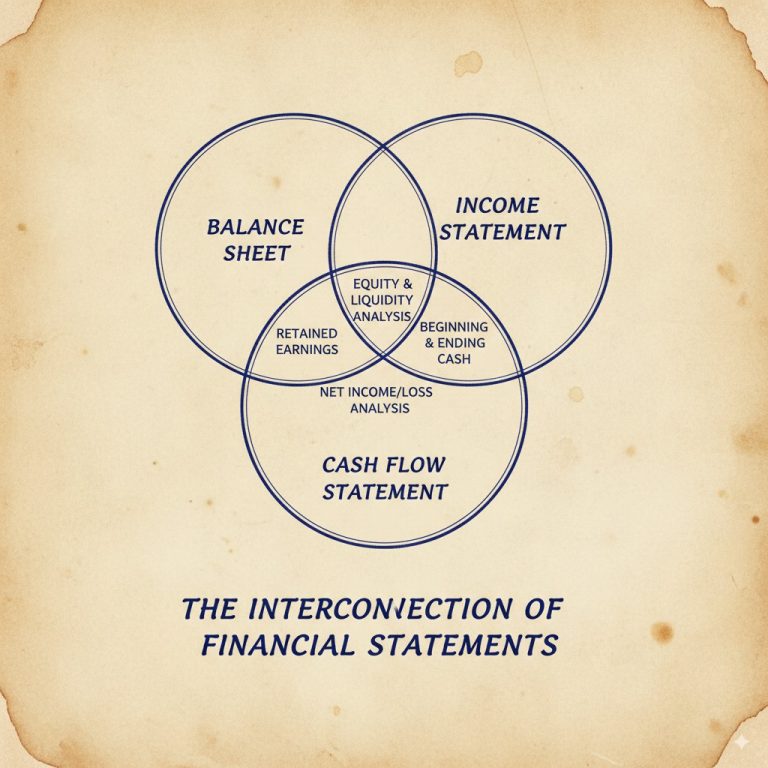
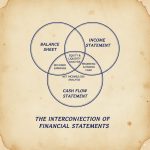
So far, we’ve explored the income statement and cash flow statement, two crucial documents for evaluating a company’s financial health. But there’s a third piece to this puzzle: the balance sheet. While the income statement shows profitability and the cash flow statement tracks liquidity, the balance sheet provides a snapshot of a company’s financial health. Learning how to read a balance sheet is key to seeing what a company owns, what it owes, and its overall financial position at a specific point in time.
Think of it as a financial X-ray—helping you see the company’s bones.
Section 1: What Is a Balance Sheet? The Accounting Equation Explained
The balance sheet is built on the fundamental accounting equation:
Assets = Liabilities + Equity
- Assets: What the company owns (e.g., cash, inventory, property).
- Liabilities: What the company owes (e.g., loans, accounts payable).
- Equity: The shareholders’ claim on the company’s assets after liabilities are deducted. It’s essentially the company’s net worth.
The balance sheet is always “balanced” because assets must equal liabilities plus equity. If a company takes out a loan (liability), its cash (asset) increases, keeping the equation in balance.
Analogy: Imagine your personal finances. If you own a car worth $20,000 (asset) and have a $10,000 loan (liability), your equity is $10,000. The same principle applies to companies.
Section 2: Key Components of the Balance Sheet
Let’s break down the main sections:
- Assets:
- Current Assets: Resources expected to be converted to cash within a year (e.g., cash, accounts receivable, inventory).
- Non-Current Assets: Long-term resources (e.g., property, equipment, patents).
- Liabilities:
- Current Liabilities: Obligations due within a year (e.g., accounts payable, short-term debt).
- Non-Current Liabilities: Long-term obligations (e.g., long-term debt, pensions).
- Equity:
- Shareholders’ Equity: The residual interest after liabilities are deducted. Includes retained earnings (profits reinvested in the business) and paid-in capital (money invested by shareholders).
Example: A company has $500,000 in assets, $200,000 in liabilities. Its equity would be $300,000 ($500,000 – $200,000). This shows shareholders’ claim on the company’s assets after debts are paid.
Section 3: How to Analyze a Balance Sheet with Key Financial Ratios (Ratio Analysis Made Simple)
Ratios help you interpret the balance sheet and assess financial health:
- Debt-to-Equity Ratio:
- Formula: Total Liabilities / Shareholders’ Equity
- What It Shows: How much of the company’s financing comes from debt versus equity. Lower ratios indicate less risk.
- Example: A ratio of 1 means liabilities equal equity. A ratio of 2 suggests the company has twice as much debt as equity.
- Current Ratio:
- Formula: Current Assets / Current Liabilities
- What It Shows: Ability to pay short-term obligations. A ratio above 1 is generally healthy.
- Example: Current assets of $100,000 and current liabilities of $50,000 yield a ratio of 2, indicating strong short-term liquidity.
- Equity Ratio:
- Formula: Shareholders’ Equity / Total Assets
- What It Shows: The proportion of assets financed by shareholders. Higher ratios indicate less debt reliance.
- Example: Equity of $300,000 and assets of $500,000 yield a ratio of 0.6 (60%), suggesting 60% of assets are equity-financed.
Section 4: Case Study: Analyzing a Tech Company’s Balance Sheet
Let’s apply this to a fictional tech company, TechGrow Inc.:
- Assets: $1,000,000 (including $300,000 cash, $200,000 in equipment)
- Liabilities: $400,000 (including $100,000 in loans)
- Equity: $600,000
Calculations:
- Debt-to-Equity Ratio: 0.67 ($400,000 / $600,000) → Indicates moderate debt usage.
- Current Ratio: 3 ($300,000 cash / $100,000 liabilities) → Strong liquidity.
- Equity Ratio: 0.6 ($600,000 / $1,000,000) → 60% equity-financed assets.
Takeaway: TechGrow has manageable debt, strong liquidity, and a healthy equity position—signs of a financially stable company.
Section 5: Common Pitfalls in Balance Sheet Analysis
- Ignoring Trends: Look at multiple periods to spot trends. A one-time high debt might not be alarming, but increasing debt over years could be.
- Overlooking Footnotes: Companies often hide details in footnotes. Read them to understand contingencies like lawsuits or pending expenses.
- Comparing Apples to Oranges: Only compare companies within the same industry. A high debt-to-equity ratio might be normal for utilities but risky for tech firms.
Conclusion
The balance sheet is your snapshot of a company’s financial position. A thorough balance sheet analysis, which involves understanding assets, liabilities, and equity and using key ratios, allows you to assess a company’s stability and risk.
Remember:
- Healthy Companies: Have more assets than liabilities, manageable debt, and growing equity.
- Red Flags: Rising liabilities, shrinking equity, or declining liquidity.
In our next blog, we’ll connect the dots between the income statement, cash flow statement, and balance sheet to give you a comprehensive view of a company’s finances. Stay tuned!
Ready to analyze a balance sheet? Pick a company you’re interested in and look up their latest financials. Try calculating the debt-to-equity and current ratios. Share your findings!